

CHART: Denver layoffs by agency
| General Fund Agency | Filled | Vacant | Transfers | Total | Total 2025 FTE (All Funds) | Filled % | Filled + Vacant % |
|---|---|---|---|---|---|---|---|
| Children’s Affairs | 10 | 2 | – | 12 | 31 | 31.8% | 36.6% |
| City Attorney’s Office | 11 | 27 | – | 38 | 244 | 4.5% | 15.6% |
| Climate Action, Sustainability, and Resiliency | 5 | 22 | 17 | 44 | 97 | 5.2% | 27.8% |
| Community Planning & Development | 19 | 40 | – | 59 | 308 | 6.2% | 19.1% |
| Denver Fire | – | 16 | 2 | 18 | 1,168 | 0.0% | 1.4% |
| Denver Police | – | 10 | – | 10 | 1,945 | 0.0% | 0.5% |
| Denver Public Library | – | 99 | – | 99 | 870 | 0.0% | 11.4% |
| Department of Safety | – | 29 | – | 29 | 516 | 0.0% | 5.6% |
| Economic Development & Opportunity | 7 | 15 | 4 | 25 | 145 | 4.8% | 14.8% |
| Emergency Management | – | 2 | – | 2 | 19 | 0.0% | 10.8% |
| Excise & Licenses | 3 | 5 | – | 8 | 56 | 5.4% | 14.4% |
| Finance | 6 | 56 | 2 | 64 | 433 | 1.4% | 14.2% |
| General Services | 4 | 20 | – | 24 | 164 | 2.4% | 14.7% |
| Housing Stability | 2 | 12 | 3 | 17 | 122 | 1.6% | 11.5% |
| Human Resources | 18 | 13 | – | 31 | 158 | 11.4% | 19.6% |
| Human Rights & Community Partnerships | 9 | 8 | – | 17 | 45 | 20.0% | 37.8% |
| Mayor’s Office | 3 | 8 | – | 11 | 46 | 6.5% | 23.9% |
| Parks & Recreation | 8 | 53 | 17 | 78 | 1,232 | 0.6% | 5.0% |
| Public Health & Environment | 16 | 17 | 19 | 52 | 371 | 4.3% | 8.8% |
| Sheriff | – | 61 | – | 61 | 1,078 | 0.0% | 5.7% |
| Social Equity & Innovation | 10 | 2 | – | 12 | 52 | 19.2% | 23.1% |
| Special Events | – | 0.3 | 7 | 7.3 | 7.3 | 0.0% | 4.5% |
| Technology Services | 7 | 42 | – | 49 | 352 | 2.0% | 13.9% |
| Transportation & Infrastructure | 31 | 108 | 21 | 160 | 1,562 | 2.0% | 8.9% |
| Total | 169 | 666 | 92 | 927 | 11,023 | 1.5% | 7.6% |

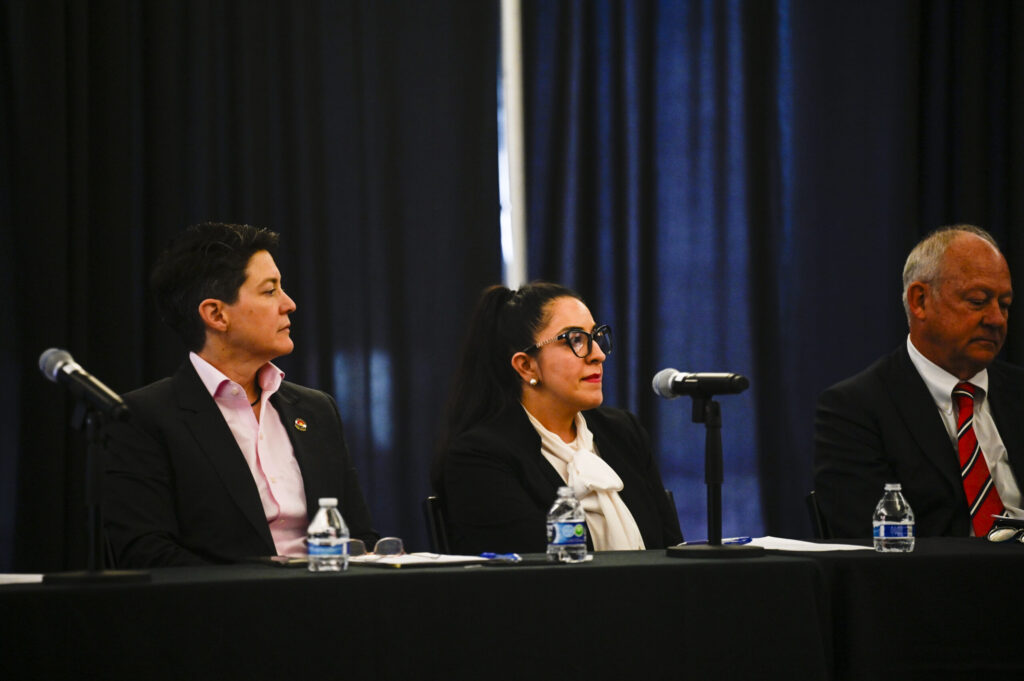
How would Weiser, Bottoms, Bennet, Kirkmeyer address Colorado’s affordability problem? | Paula Noonan
Paula Noonan
paula-noonan@coloradopolitics.com
Updated 2 hours ago
It’s decision time in Colorado as primary election ballots hit mailboxes this week. Democrats will pick their candidates in every statewide race, and Republicans select candidates for governor and Attorney General. GOP operatives wanted to exclude unaffiliated voters from their...

The new trustees report is a wake-up call for Congress | GUEST COLUMN
Colorado Politics
colorado-politics@coloradopolitics.com
Updated 2 hours ago
By Sara Schueneman Every year, the Social Security Trustees Report provides an important snapshot of the long-term outlook for one of America’s most popular and important initiatives. This year’s report sends a clear message: Congress needs to act. The latest...
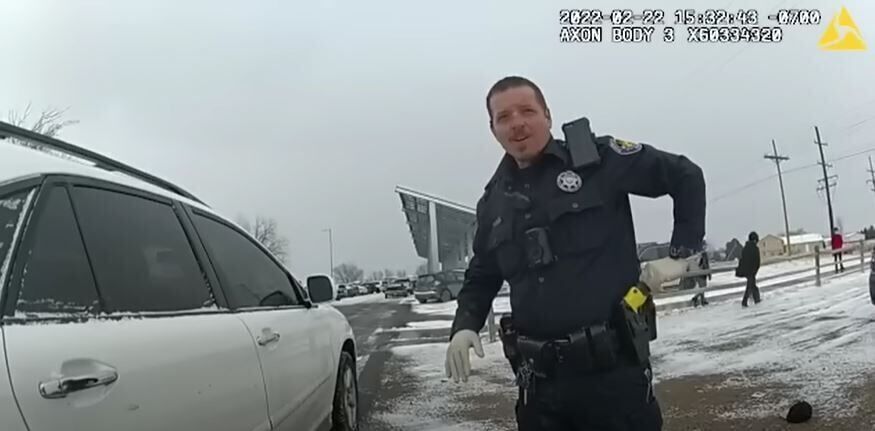
Colorado Supreme Court upholds police search of car based on arm movements
Michael Karlik
michael.karlik@coloradopolitics.com
Updated 5 hours ago
The Colorado Supreme Court decided last week that Denver officers’ search of a vehicle was constitutional, based on their perception of the occupants’ arm movements that a trial judge found to not be credible. Officers Keegan Grubb and Richard Eberharter...
Flat or graduated income tax? Colorado groups push dueling measures for November election
Marissa Ventrelli
marissa.ventrelli@coloradopolitics.com
Updated 9 hours ago
Colorado voters could face two opposing income-tax measures on the November ballot, with the dueling campaigns seeking to advance proposals that would take the state in sharply different fiscal directions. One initiative seeks to replace Colorado’s flat income tax with...
10th Circuit tosses Pueblo County sheriff defendants’ appeal in fatal shooting lawsuit
Michael Karlik
michael.karlik@coloradopolitics.com
Updated 12 hours ago
The Denver-based federal appeals court rejected an attempt from Pueblo County sheriff’s employees on Wednesday to rely on their own version of the facts to escape liability for fatally shooting an unarmed man outside a middle school. A trial judge...

Backers of Colorado road-funding initiative reject withdrawal deadline, negotiations with lawmakers continue
Marissa Ventrelli
marissa.ventrelli@coloradopolitics.com
Updated 10 hours ago
The standoff over Colorado’s road‑funding initiative will continue after supporters declined state lawmakers’ request to withdraw the measure, while both sides signaled they are still willing to pursue a broader agreement ahead of the fall deadline. Initiative No. 175, backed...

US primed for summer of unpredictable gas prices as Iran war rages on: ‘Living this uncertainty’
Emily Hallas, Washington Examiner
emily.hallas.washington.examiner@gazetteedit.wpenginepowered.com
Updated 12 hours ago
The war with Iran has made summer gas prices unpredictable, as President Donald Trump’s shifting messaging on hostilities keeps the energy markets in limbo. There’s little concrete direction on where gas prices could go in the coming months, an expert...

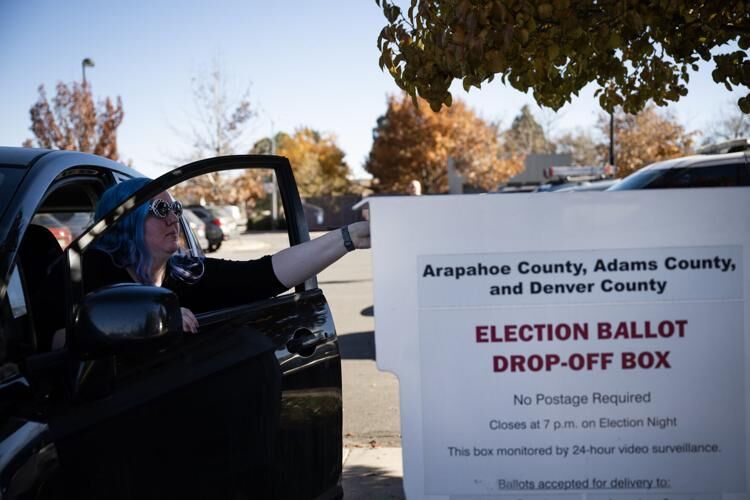
USPS proposes changes to mail-in ballots in states that don’t hand over voter rolls
Molly Parks, Washington Examiner
molly.parks.washington.examiner@gazetteedit.wpenginepowered.com
Updated 10 hours ago
The Postal Service proposed a new rule pushing states to turn over their mail-in and absentee voter rolls to the agency, a move in line with President Donald Trump’s March executive order tightening regulations on mail-in voting in federal elections....
Colorado justices uphold strict interpretation of consumer protection law against debt collector
Michael Karlik
michael.karlik@coloradopolitics.com
Updated 8 hours ago
The Colorado Supreme Court concluded last month that a debt collector failed to comply with state law by suing a woman for an unpaid credit card debt without documentation that it owned her account. Portfolio Recovery Associates, LLC filed a...

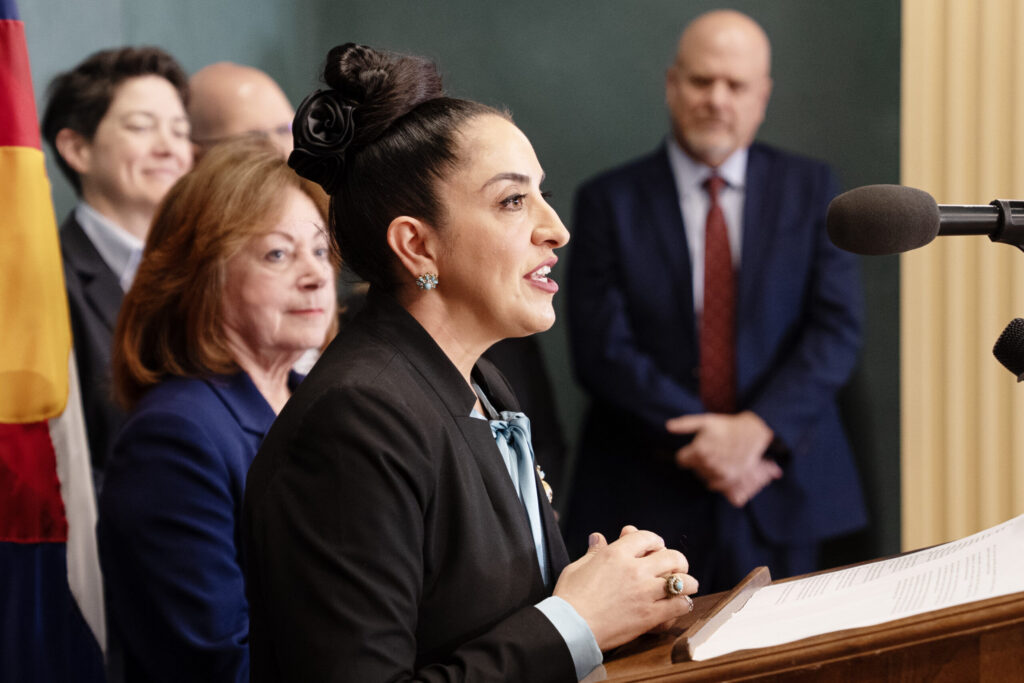
Colorado lupus patients can’t afford ‘most favored nation’ drug pricing | PODIUM
Colorado Politics
colorado-politics@coloradopolitics.com
Updated 1 day ago
By Kristy Kibler When you live with lupus, you learn quickly waiting is not an option. Lupus is unpredictable: flares can escalate overnight, organs can be damaged quickly, and access to the right treatment at the right time can determine...